Background
Food Insecurity and COVID-19
Food insecurity is the lack of consistent access to food
adequate to sustain a healthy and active lifestyle.
| 2019 |
2020 |
|
1.2 million
|
2.0 million
(↑67%)
|
| NYC residents experiencing food insecurity |
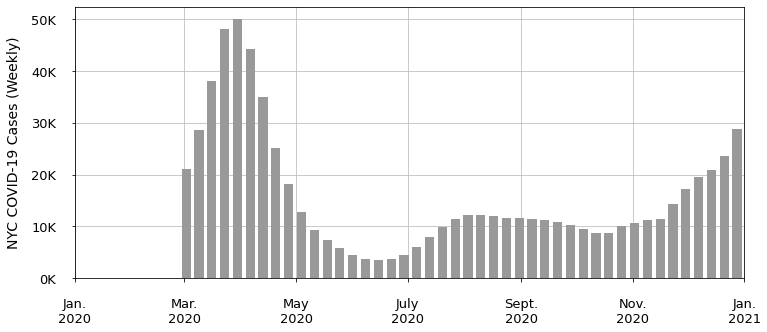
Figure 1 - Three-week average of COVID-19 cases in
NYC
Food Insecurity and Health Outcomes
Food insecurity has been consistently associated with negative health
outcomes, including diet-related diseases, mental health, and comorbities
with COVID-19 (Gundersen & Ziliak, 2015; CDC COVID-19 Response Team, 2020).
Food Acquisition Behaviors and Nutrition During COVID-19
Food secure NYC residents were also impacted by changes in food acquisition
behavior by COVID-19. "NYC Food 20/20" (2020) reported the following impacts
on food retail and services:
Reported Impacts on Food Retail
Reported Impacts on Food Service
- Reduced frequencies of food shopping
- Lower availability of supermarket staples
- Lower priced items out of stock
- Lower availability of essential items in low-income neighborhoods
- Reduced restaurant spending
- Higher closures of independent restaurants run by women, immigrants, and minorities
- Lower impact on chain restaurants with greater financial capital
According to CUNY School of Public Health (2020) survey data, 54%
of respondents reported having a less healthy diet than
pre-pandemic. Lower income households also reported consuming more
packaged food than higher income households, which has generally lower
nutritional value than fresh foods.
Problem Statement
During the COVID-19 pandemic, vulnerable populations in NYC had excessive
difficulty in safely obtaining affordable and nutritious food as typical
avenues for food access were massively disrupted for sustained periods of
time.
The public health dangers and policy responses to COVID-19 exacerbated
inequitable food access, and thus disproportionately increased food
acquisition patterns associated with negative health outcomes.
The authors sought to inform future food resiliency strategies in NYC by
connecting mobility data to the existing scientific basis of associations
between nutrition, food insecurity, and diet-related diseases.
Results
-
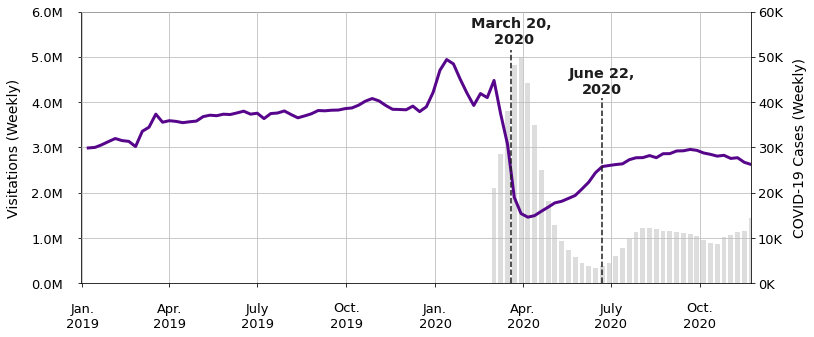
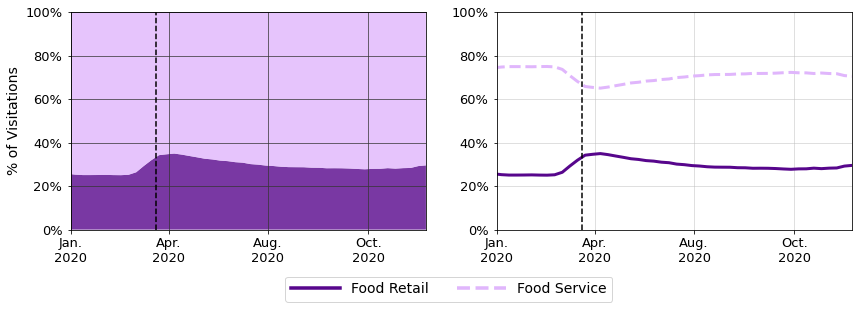
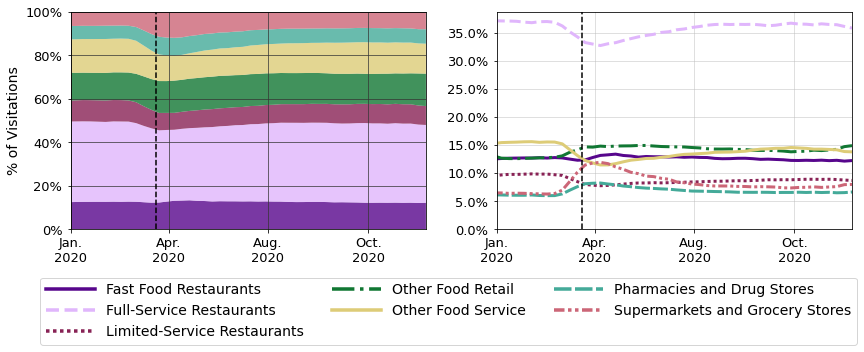
Figure 2a - Three-week average of COVID-19 cases in
NYC and weekly food location visitations.
-
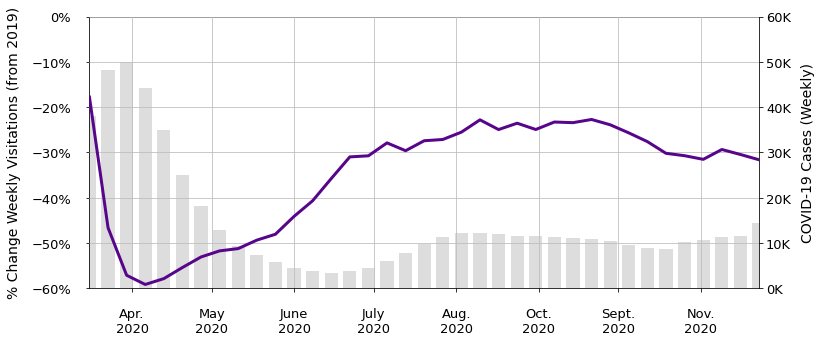
Figure 2b - Three-week average of COVID-19 cases
in NYC and percent change in weekly food location visitations
from 52 weeks prior.
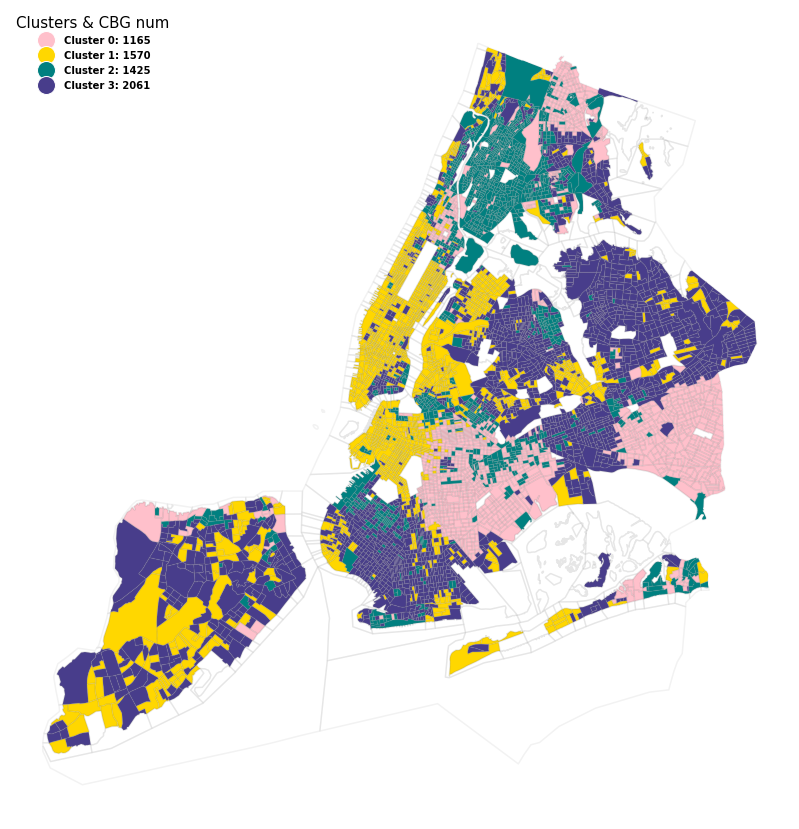
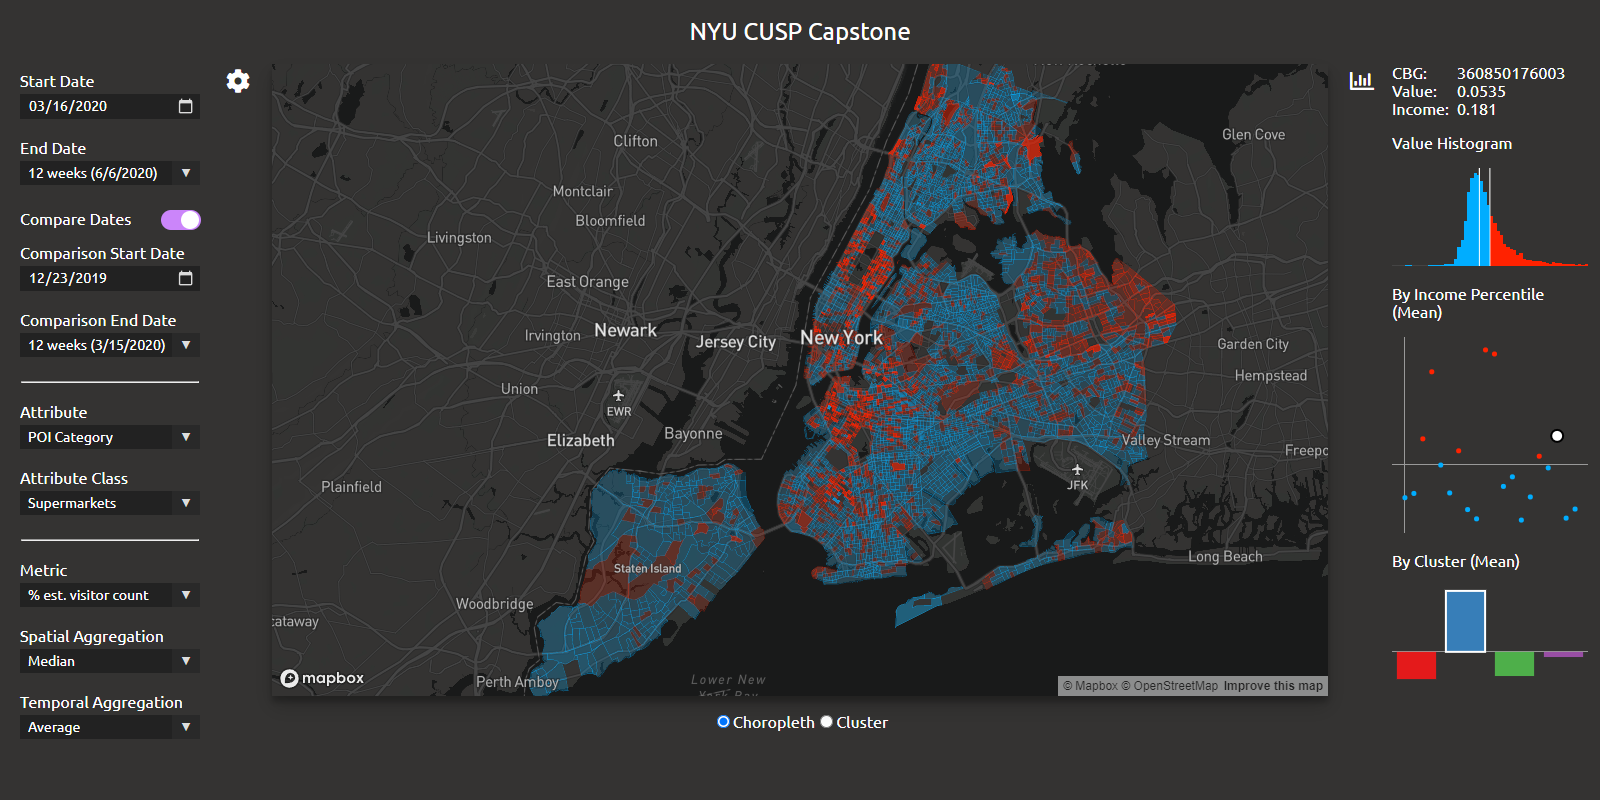
Figure 3 - Clustered CBGs on the map (excluded CBGs
with population under 10)
|
Income Level |
Education Level |
Families with Elderly & Children |
Ethnic Composition |
Families Receiving Food Assistance Benefits |
POI Count |
| Cluster #0 |
Moderate |
Moderate |
More elderly |
More Black and African American |
Moderate |
More Supermarkets, more Fast-Food Restaurants |
| Cluster #1 |
Higher |
Higher |
Fewer |
More White |
Fewer |
More Food Service, fewer Supermarkets |
| Cluster #2 |
Lower |
Lower |
More children |
More evenly-distributed |
More |
More Supermarkets, more Fast-Food restaurants |
| Cluster #3 |
Moderate |
Moderate |
More elderly |
More White and Asian |
Moderate |
Fewer Supermarkets |
|
Income Level |
Education Level |
Families with Elderly & Children |
| Cluster #0 |
Moderate |
Moderate |
More elderly |
| Cluster #1 |
Higher |
Higher |
Fewer |
| Cluster #2 |
Lower |
Lower |
More children |
| Cluster #3 |
Moderate |
Moderate |
More elderly |
|
Ethnic Composition |
Families Receiving Food Assistance Benefits |
POI Count |
| Cluster #0 |
More Black and African American |
Moderate |
More Supermarkets, more Fast-Food Restaurants |
| Cluster #1 |
More White |
Fewer |
More Food Service, fewer Supermarkets |
| Cluster #2 |
More evenly-distributed |
More |
More Supermarkets, more Fast-Food restaurants |
| Cluster #3 |
More White and Asian |
Moderate |
Fewer Supermarkets |
Table 1 - Demographic and socioeconomic characteristics
and POI Count summarized from the analytical plots. (The POI Count
indicates the number of different types of POIs, which is counted by the
unique place keys within the cluster area).
-
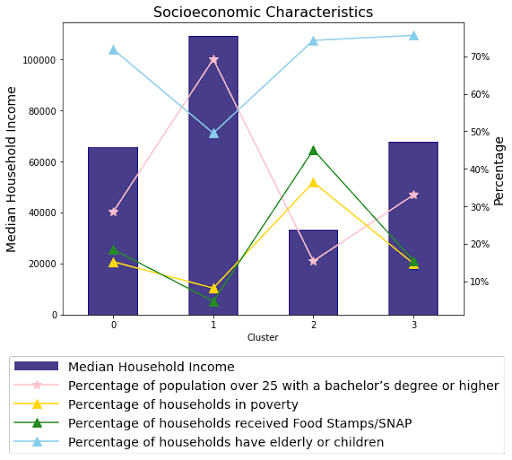
Figure 4a - Income, education, poverty, SNAP,
and age characteristics of each cluster.
-
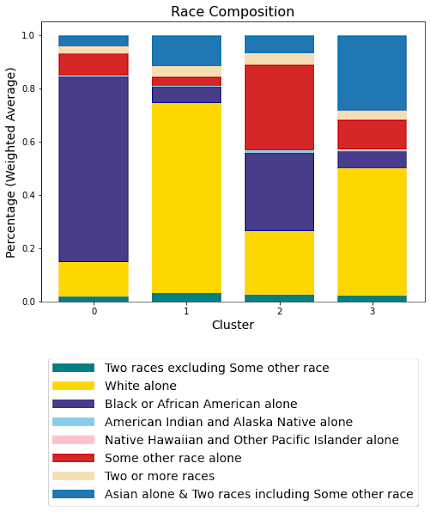
Figure 4b - Race composition of each cluster.
-
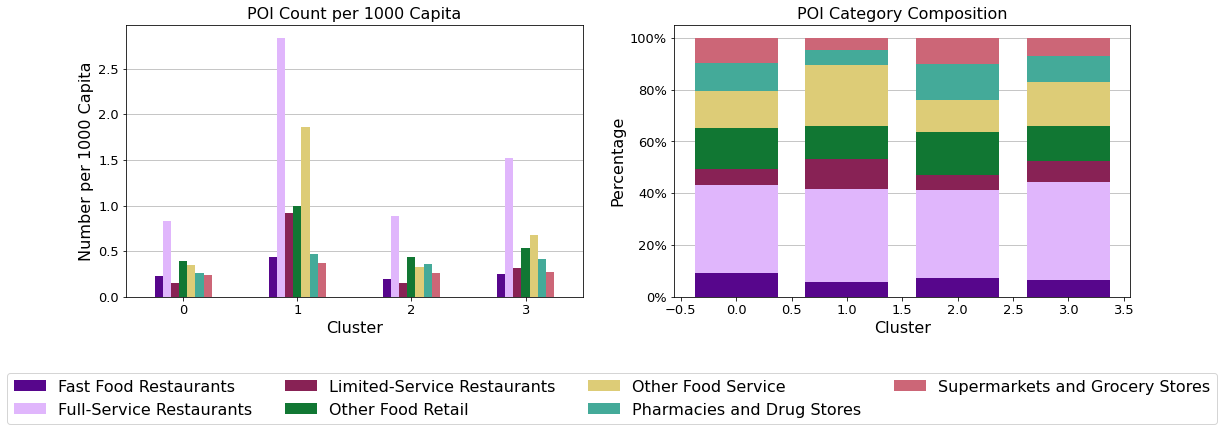
Figure 4c - POI Count (the number of different
types of POIs) by category in different clusters.
-
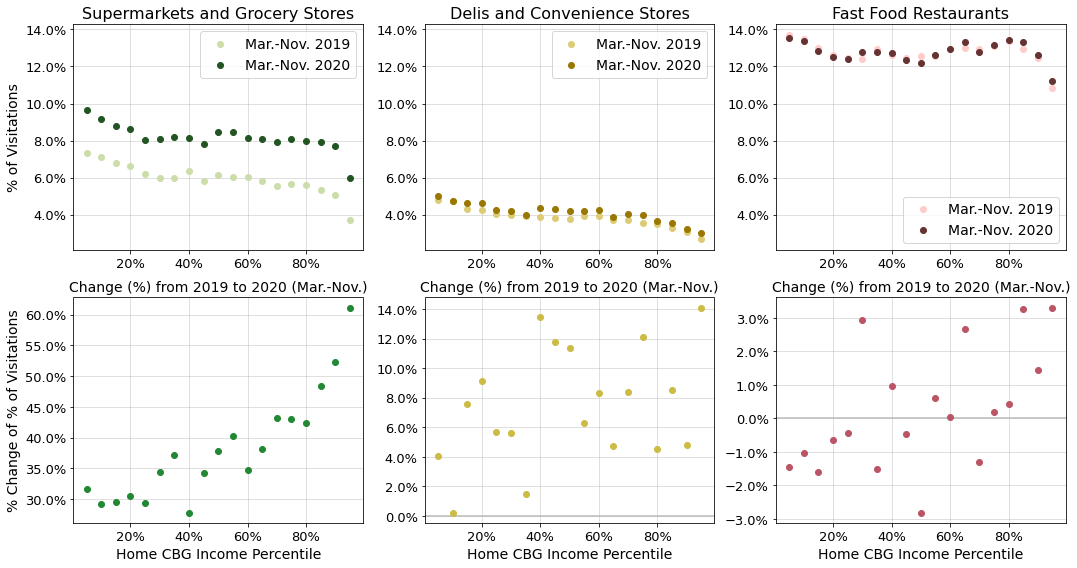
Figure 6 - Selected POI category visitation
distributions by home CBG income percentile; median percentage
(top), and percent change in median percentage (bottom).
-
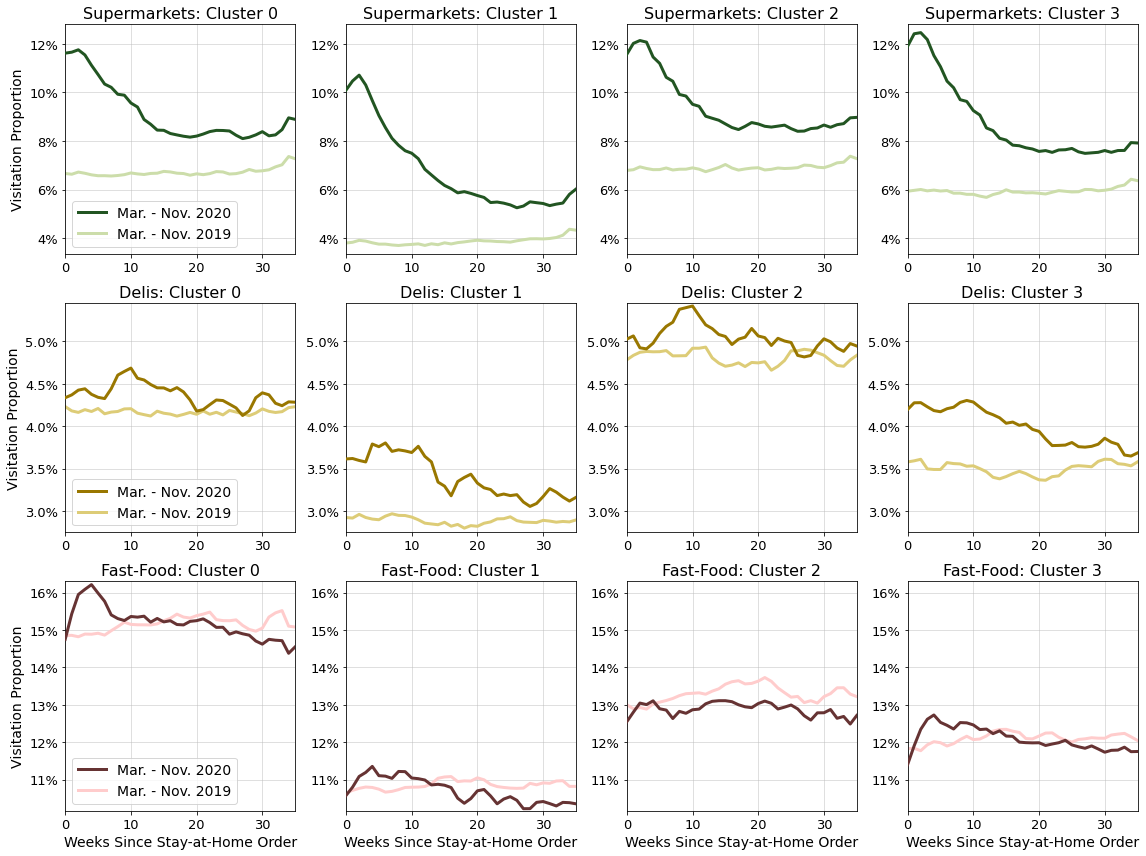
Figure 7 - Selected POI category visitation
distributions by demographic and socioeconomic cluster between
March 16 - November 23, 2020 compared to 52 weeks prior;
supermarkets (top), delis (center), and fast-food restaurants
(bottom).
-
In the immediate weeks surrounding the initial NYC stay-at-home order,
food service visitation proportion dropped substantially before partially
recovering over the summer (Figure 5a).
-
Changes in POI category visitation proportions varied by income
percentile (Figure 6).
-
Supermarket and deli visitation proportions generally increased by a
greater amount for high-income CBGs (Figure 6).
-
Fast-food visitation proportions increased for high-income CBGs and
decreased for low-income CBGs (Figure 6).
-
Clusters #0 and #2 maintained the overall highest supermarket and deli
proportions whereas clusters #1 and #3 experienced the greatest initial
increases (Figure 7).
-
Clusters #0, #1, and #3 all temporarily increased fast-food proportions
above pre-pandemic levels, with cluster #0 maintaining the highest
overall value (Figure 7).
CDI
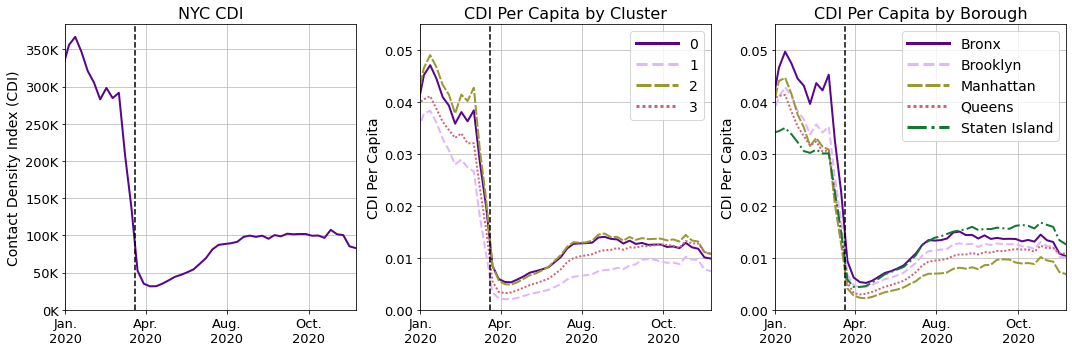
Figure 8 - Three-week average CDI at food
locations in NYC over time (left). Three-week average CDI per
capita by cluster (center) and by borough (right) over time.
-
After the initial stay-at-home order in NYC, CDI across all
categories decreased (Figure 8) consistent with findings by Verma et
al. (2021).
-
Rankings of CDI per capita by home CBG cluster did not significantly
change.
-
Manhattan and Staten Island switched relative rankings and followed
different distributions (99% CI).
Consistency with Reported Food Acquisition Behaviors
Visitation totals showed trends consistent with NYC survey data from May
2020 which reported that 64% of respondents shopped less
frequently and 49% ate more packaged food compared to before the
pandemic (CUNY School of Public Health, 2020); food retail
visitation totals were 50% lower in May 2020 year-over-year, but formed a
greater proportion.
Disproportionate Supermarket Resiliency
Shoppers from low-income neighborhoods and clusters with higher
rates of children and older residents had the greatest
supermarket dependency. Low-income shoppers also reported the
unavailability of essential and lower-priced food items at greater rates
(CUNY Urban Food Policy Institute, 2020) despite having the smallest
increases in supermarket dependency.
This suggested disparity in supermarket resiliency which
exacerbated harm to high-poverty communities and individuals with
diet-related diseases associated with food insecurity
(Gundersen and Ziliak, 2015) who were already at greater risk from
COVID-19 (Arasteh, 2021; CDC COVID-19 Response Team, 2020).
Increased Dependencies on Unhealthy Eating Establishments
Fast-food dependency temporarily increased citywide as
non-fast food restaurant visitation proportions declined. CUNY School of
Public Health (2020) surveys found that compared to pre-pandemic
behavior: 54% of respondents reported having a less healthy diet,
and lower-income, Black, and Latinx households consumed more packaged
food at higher rates. These reports were consistent with
observed fast-food and deli visitation proportions in total and by
clusters.
CDI Disparity Followed COVID-19 Infection Disparity
Clusters and boroughs with higher CDIs also included
neighborhoods with the highest COVID-19 infections per capita
(NYC Health, 2021). CDI model limitations prevented drawing policy
recommendations specific to the food sector with confidence. However, CDI
could potentially act as a broad diagnostic metric for outlier detection
in future work.
Preventing Food Supply Disruption
Clusters #0 and #2 had the highest supermarket dependency, and thus were the
most susceptible to food supply disruption when stay-at-home orders closed
many food service options. This signaled that the greatest need to
mitigate supermarket supply disruption was located in
central and south Brooklyn, central and east Queens, and the
Bronx. Expanding food supply in such neighborhoods may be the
most effective direction of food insecurity reduction efforts.
Supporting Non-Fast Food Restaurants
After the initial stay-at-home order, most clusters and high-income
neighborhoods increased their fast-food visitation proportions. These chain
restaurants had the greatest financial resources to remain open. Meanwhile,
over 1,000 NYC restaurants permanently closed with women and minority-owned
businesses impacted disproportionately. Preserving greater
nutritional choice to support stronger immune responses could be
accomplished by ensuring immediate financial support to non-fast
food services in future public health emergencies.
Conclusions
Survey data showed that shoppers from low-income and minority
neighborhoods in NYC were more likely to experience supermarket food
supply disruption, while mobility data showed that these same shoppers
were also more dependent on supermarkets for a larger proportion of their
diet.
Therefore, a comprehensive food resiliency strategy to reduce food
insecurity and the resulting negative health outcomes during public health
emergencies should:
-
Expand food access in neighborhoods with the greatest supermarket
dependency in order to maintain food supply
-
Support non-fast food restaurants to ensure access to nutritious food
-
Boost financial support to emergency food programs serving low-income
neighborhoods where supermarket resiliency is disproportionate
The rise in food insecurity in NYC and its associated negative health
outcomes require persistent monitoring for adverse long-term health
impacts, recognition of the disparity in the city�$B!G�(Bs food resiliency
system, and the collective support of New Yorkers to strengthen its
weaknesses.
Credits
Chris Carey
Maia Guo
Nuoyi Wang
Project Manager
Data Visualization Lead
Data Engineer
Data Modeling Lead
Research Analyst
Data Analytics Support
Designed project milestones, estimated work effort, tracked progress,
and communication; led the implementation of client-facing data
visualizations.
Led data extraction, integration, and processing; responsible for
Machine Learning modeling; supported spatiotemporal data analysis.
Led theoretical support and direction guidance for research; led policy
research; conducted time analysis; supported data integration, data
processing and exploration analytics.
 CUNY Graduate School of Public Health & Health Policy
CUNY SPH // Sponsor
The CUNY Graduate School of Public Health & Health Policy (CUNY SPH)
is committed to teaching, research and service that creates a healthier
New York City and helps promote equitable, efficient and evidence-based
solutions to pressing health problems facing cities around the world.
 NYU Center for Urban Science + Progress
NYU CUSP // Sponsor
New York University's Center for Urban Science And Progress (CUSP) is an
interdisciplinary research center dedicated to the application of
science, technology, engineering, and mathematics in the service of urban
communities across the globe.
 Huy T. Vo
Assistant Profressor (CS@CUNY-CCNY)
Research Assistant Profressor (NYU-CUSP)
Capstone Mentor
Huy T. Vo is an assistant professor affiliated to both NYU CUSP and CUNY
CCNY. His research interests involve big data analytics, large-scale
visualization and high-performance computing.